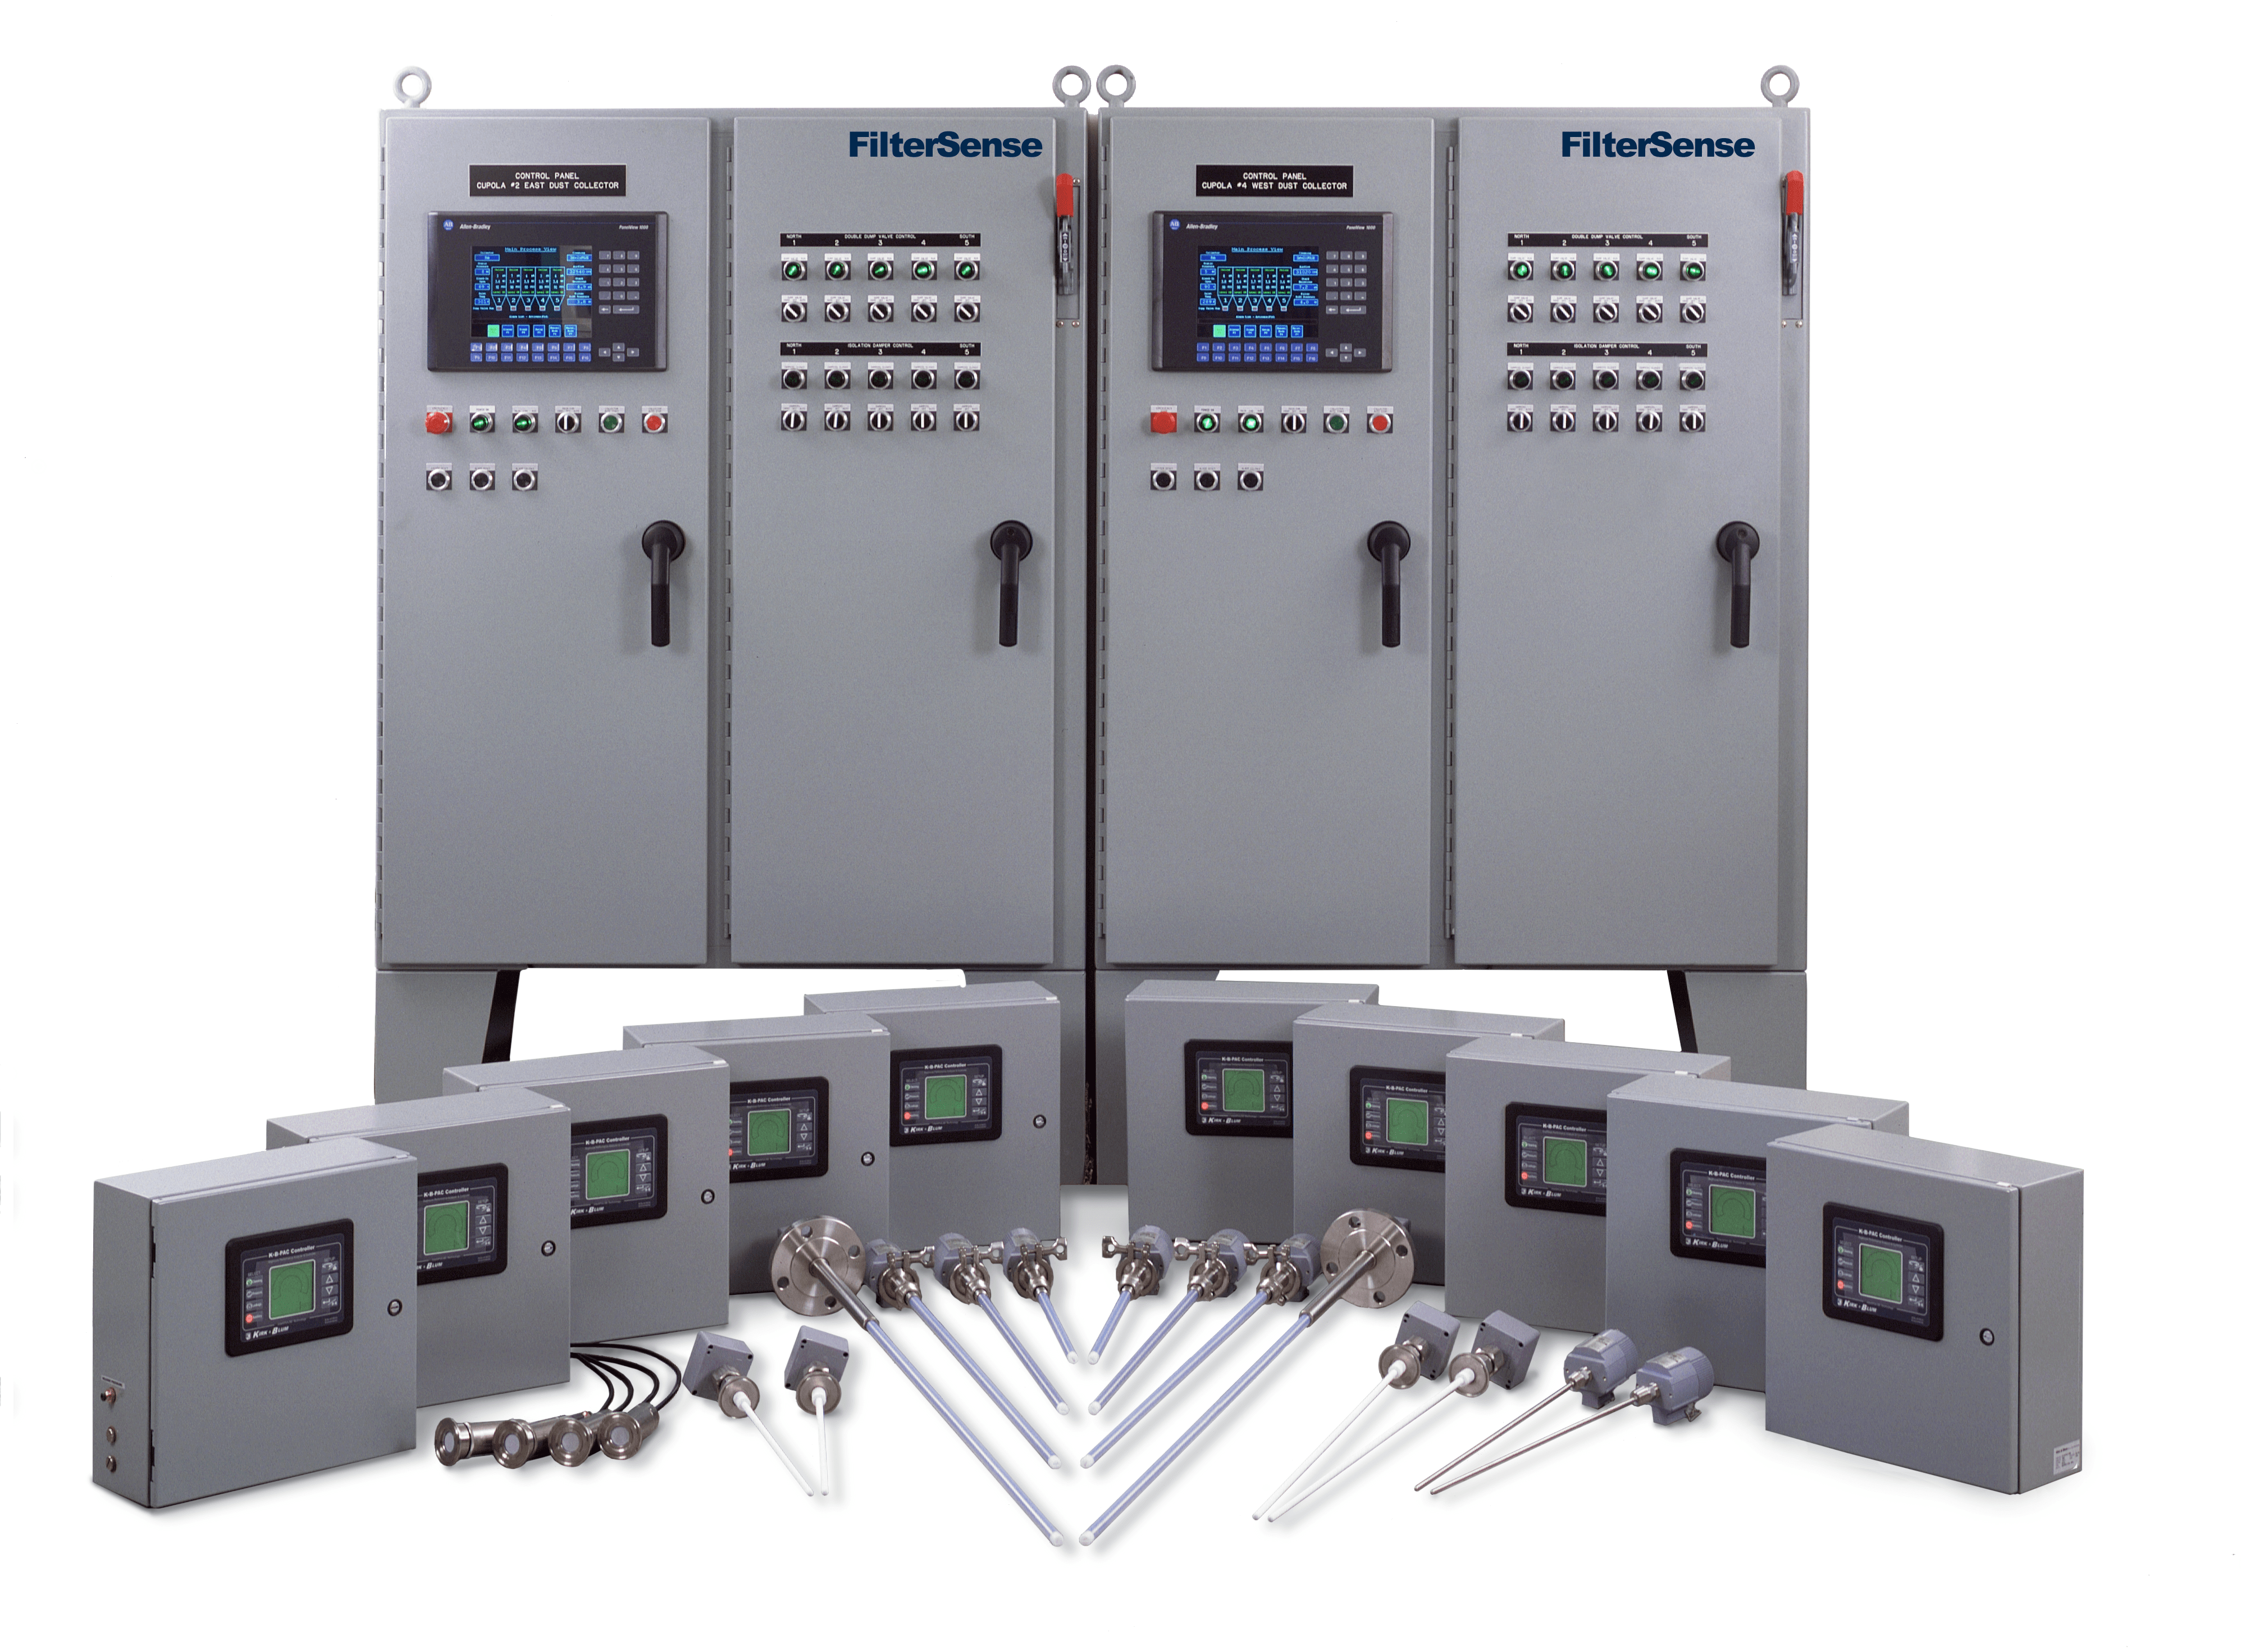
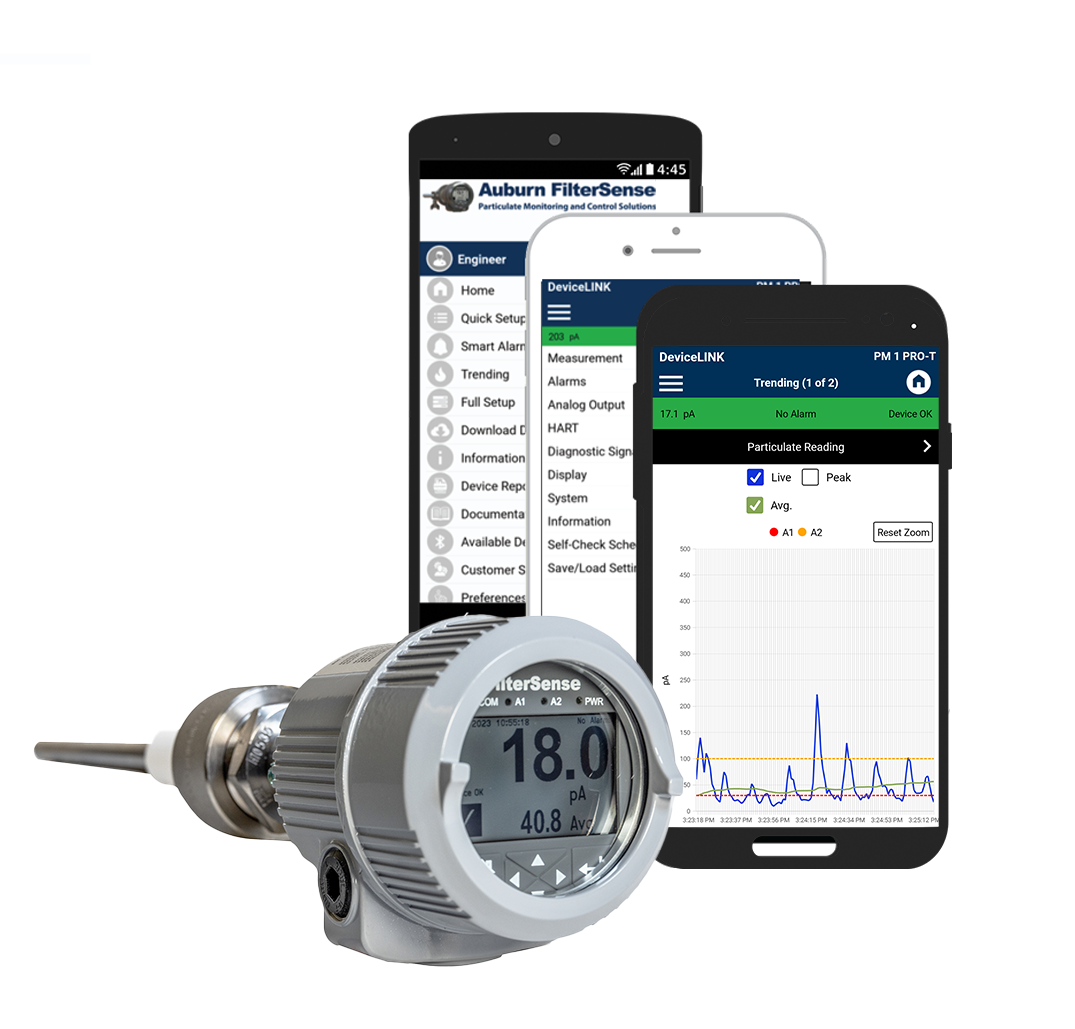
Particulate Measurement & Control Solutions
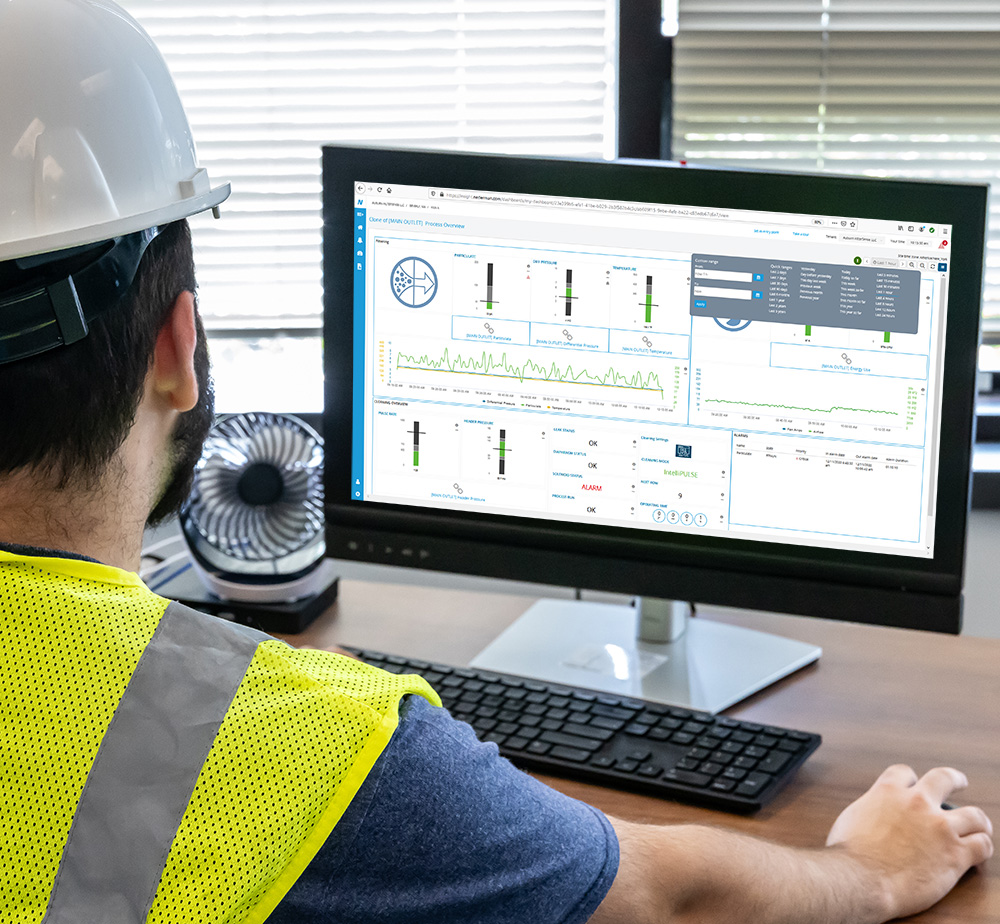
Improve Plant Operations, Conserve Energy, Ensure Compliance with Emission Regulations.
Learn More


Industries
Our Company
Auburn FilterSense has been a trusted name in the industrial particulate measurement industry for over 40 years. Our top-quality products are designed to help businesses improve production and operational efficiency, adhere to environmental emissions regulations while maintaining a clean, safe, and efficient workplace.
Proven Results & Real Solutions
Auburn FilterSense has a proven track record in the industry. With our extensive expertise and commitment to quality, you can trust that our products will delver accurate results and reliable performance for your particulate monitoring needs. We can help reduce unplanned downtime, increase operational efficiency, and support regulatory compliance needs for a wide variety of industries and all levels of applications.